Transportation Dashboard Power BI
Data visualization for the transportation industry
Let data from multiple transportation systems improve your operations
The transportation and logistics sector is full of smart It solutions. Our solutions are full with data that we and our clients are eager to bring to the forefront for creating a wide range of variable dashboards.

Some of the data we extract from transportation systems
Planning dashboard
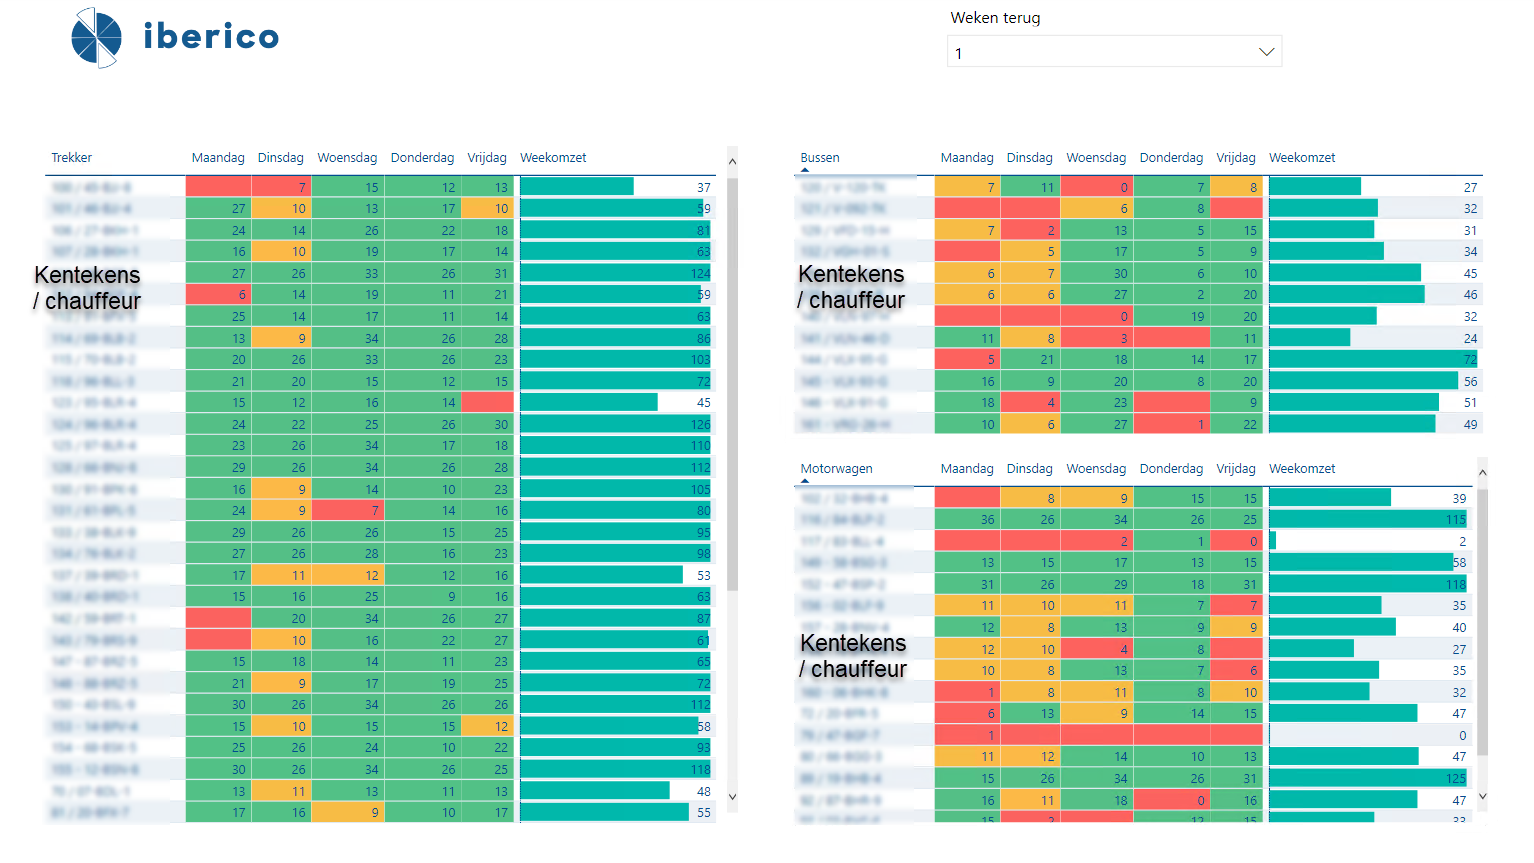
Instant visibility of volume, weight, load meter, shipments, time shipments, loading and unloading
Management dashboard
Among other things, revenue figures by period, customer, revenue type, vehicle, driver, region
Sales dashboard
Among others, customer metrics, top 20 customers, revenue gainers and decliners, and order gainers and decliners per customer.
Customer view dashboard
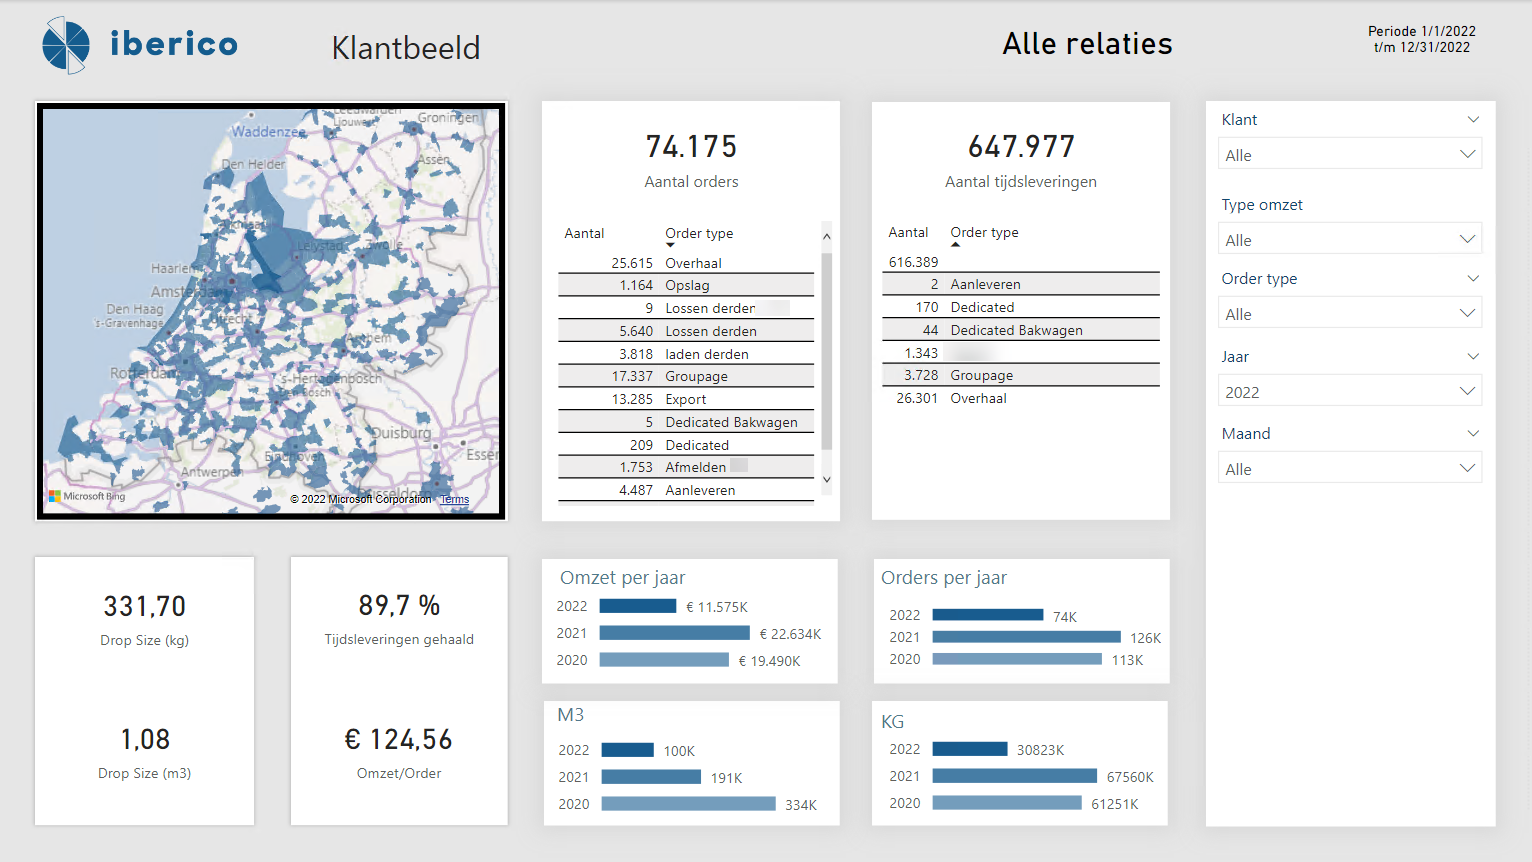
Revenue figures by period, order figures, time deliveries, loading and unloading region, Geographical data and volumes.
HR dashboard
Staffing figures based on availability by period, employability, leave, employed and out of service.
Efficient planning, loading and unloading, through the transport dashboard
Planned sales versus target sales
Instant visibility into revenue figures of scheduled trips. Useful on a screen on the wall in the planning department.
Customer view, all transport information you want insight into per customer
View client information over the past period and share dashboards for better client alignment.
Turnover figures by year
Revenue growth per customer for the past 3 years.
In-depth insights through multiple filter levels including: customer, revenue type, general ledger, plan group and order type.
Loading and unloading regions
Zoom in on last year’s loading and unloading region and make new decisions based on the insights that come from the transportation customer dashboard.
We work for the following transportation clients, among others


See the above transportation dashboards in action?
Schedule a physical or online appointment.
Iberico Intelligent Business Transformation


